
Why liquidity quietly runs your portfolio
Liquidity sounds like banker-speak, but it’s really a simple idea: how quickly and at what cost you can turn an investment into spendable cash. If you can sell something in seconds at almost the same price everyone else is seeing, it’s liquid. If you need weeks, lawyers, or big discounts to offload it, it’s illiquid. Think of liquidity as the “emergency exit width” of your portfolio: narrow doors cause traffic jams and panic, wide doors let people walk out calmly. In 2025, with faster markets and more complex products, understanding this “exit width” is as important as chasing returns.
Key terms: investment liquidity explained without jargon
Let’s pin down the core definitions so we’re not waving hands. Market liquidity is about the asset itself: how easy it is to sell at a fair price. Funding liquidity is about you: whether you have enough cash or credit to meet your obligations. Transaction liquidity is the practical mix of speed, cost and price impact when you hit the “sell” button. Put simply, investment liquidity explained in everyday language is: “If I need money, how fast can I get it, and how much do I lose on the way out?” The trade‑off is brutal but real: you often sacrifice some yield in exchange for better liquidity and peace of mind.
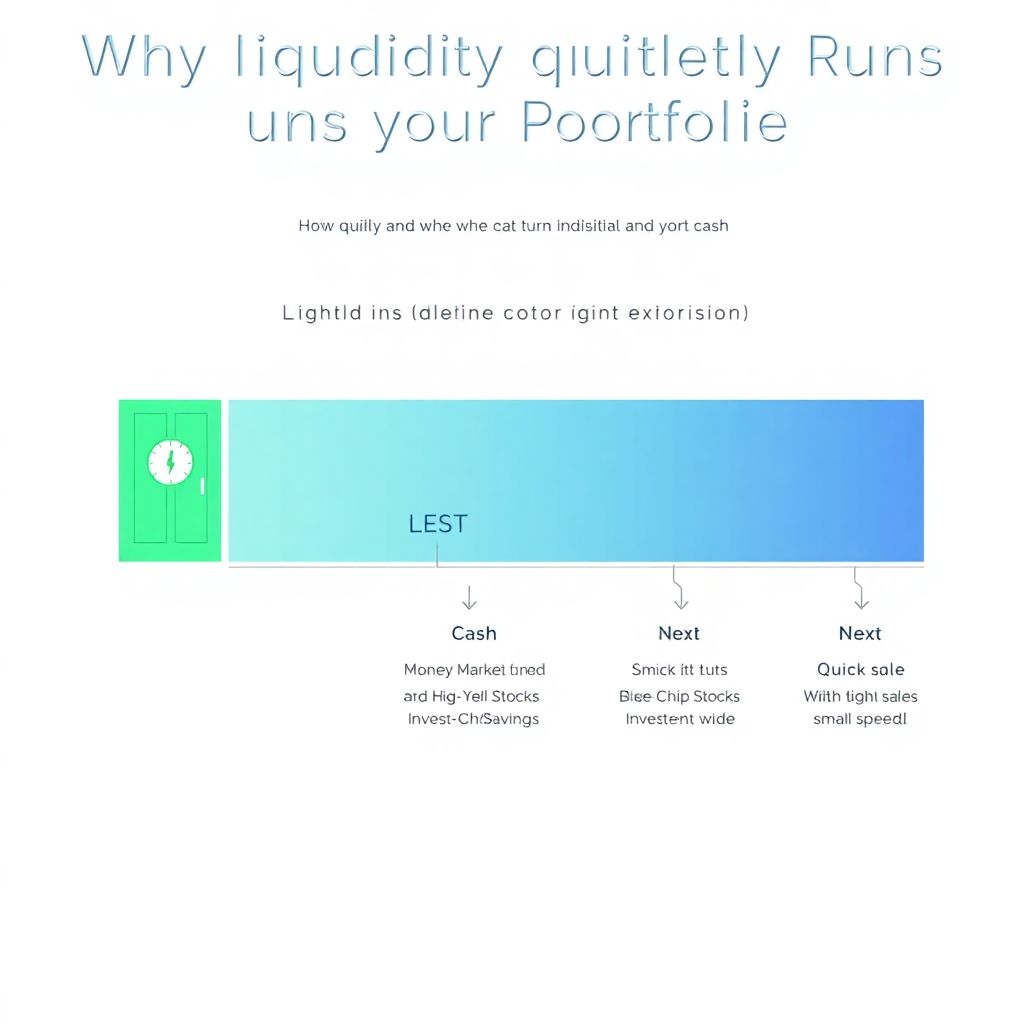
Text diagram: visualize liquidity as a spectrum, not a switch
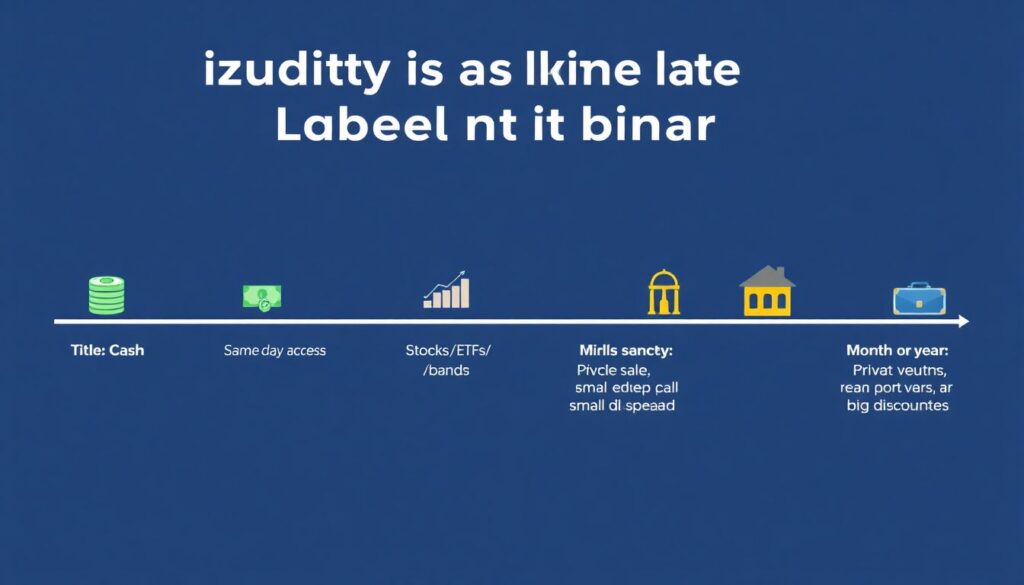
Liquidity isn’t binary; there’s a sliding scale. Imagine a horizontal line:
– Left end: “Cash” → same‑day access, no loss.
– Middle: “Listed stocks / ETFs / bonds” → quick sale, small spread.
– Right end: “Private equity, real estate, collectibles” → months or years, big discounts.
In text form:
CASH ──► MONEY MARKET FUNDS ──► ETFs / BLUE‑CHIP STOCKS ──► CORPORATE BONDS ──► PRIVATE DEALS / PROPERTY
Every step to the right usually adds return potential but shrinks your exit door. The trick is not avoiding the right side completely, but knowing exactly how stuck you might be if you suddenly need that money.
The difference between liquid and illiquid investments
The difference between liquid and illiquid investments comes down to three things: time, price and certainty. Liquid assets can be sold quickly, at a price close to the last quote, with a high chance the trade goes through. Illiquid assets take longer to sell, with more haggling and little guarantee you’ll get the value shown on paper. For instance, selling $10,000 of an S&P 500 ETF usually takes seconds; selling a $10,000 share in a small private company might require months and a willing buyer. This gap becomes painfully obvious in crises, when buyers vanish and “value” turns into “nice theory” until markets calm down.
How to assess liquidity of investments in real life
When you’re thinking about how to assess liquidity of investments, don’t stop at “Can I sell it?” Go deeper into *how* that sale would play out. Ask yourself: How many buyers are out there on a normal day? How wide is the bid‑ask spread? How much does price move when big volume hits the market? Are there lock‑ups, notice periods or legal hoops? In 2025, you can check ETF and stock liquidity with simple tools: look at average daily volume, spreads in cents, and depth of the order book. For funds and private deals, you often rely on terms in the documents: lock‑in periods, redemption windows and gates that can slow or block withdrawals.
Simple “flow diagram” of selling an asset
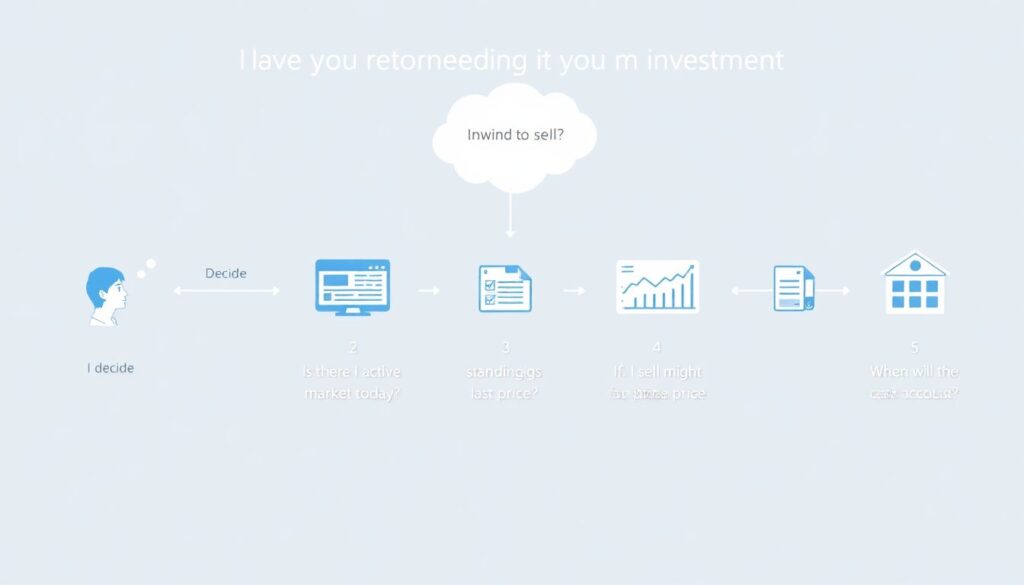
Picture a step‑by‑step flow in your head when you need cash:
1) “I decide to sell” →
2) “Is there an active market today?” →
3) “Are there standing bids close to last price?” →
4) “If I sell my size, how far might price move?” →
5) “When will the cash actually hit my account?”
For a liquid ETF, this whole chain happens in minutes with minimal price slippage. For a rental property or startup stake, step 2 might already fail: there is no continuous market, just occasional buyers. Running this mental diagram for each asset before you invest makes the eventual exit much less surprising and keeps your cash‑flow planning honest.
Best liquid investment options in 2025
If your top priority is fast access to cash without nasty surprises, the best liquid investment options in 2025 are fairly boring on purpose. They include:
– Cash and high‑yield savings accounts (instant access, but bank and inflation risk).
– Money market funds and ultra‑short bond ETFs (typically T+1 settlement, modest yield).
– Large, widely traded stock and bond ETFs (intraday liquidity with tight spreads).
All of these sit on the left or middle of our liquidity spectrum. Returns may not blow your mind, but you can tap them quickly for emergencies, margin calls, or new opportunities. The important nuance: “liquid” doesn’t mean “risk‑free”—prices can still move, especially for ETFs—but you won’t be structurally locked in.
Why liquidity risk hurts most when you least expect it
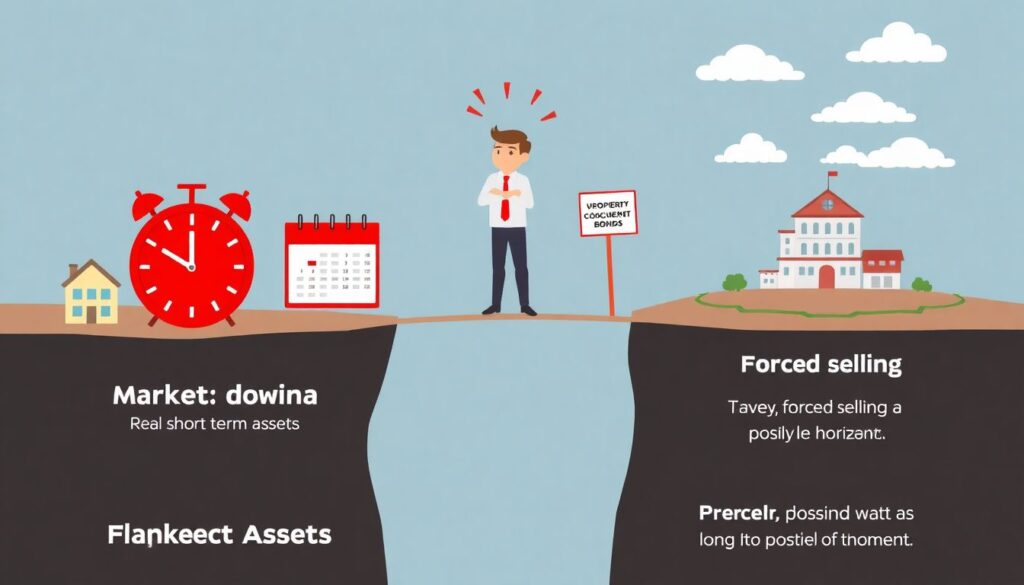
Investment liquidity risk management is mainly about avoiding forced selling at the worst possible time. Trouble shows up when your time horizon and the asset’s liquidity horizon don’t match. Classic example: you put emergency savings into a property crowdfunding platform because the yield looks nice, then lose your job and discover withdrawals are frozen. Another scenario: you rely on dividends from a thinly traded small‑cap stock; during a downturn spreads blow out, and selling a modest amount would smash the price. Good liquidity risk management accepts that life is messy and keeps enough “fast cash” around to avoid fire‑sale decisions.
Practical rules of thumb for everyday investors
To turn theory into daily habits, build a small checklist you mentally run before new investments. For instance:
– “If I had to raise 20–30% of my portfolio in a week, which positions would I sell first?”
– “Do I clearly know the settlement time and exit rules for this product?”
– “Am I being paid enough extra return to justify locking up this money?”
If your answers feel vague or optimistic, liquidity might be your blind spot. This doesn’t mean swear off illiquid assets; it means size them appropriately. In 2025, fractional real estate, private credit platforms and venture funds are aggressively marketed to retail investors. Their pitch often highlights yield and diversification, but the quiet fine print on redemption limits is where your future stress might be hiding.
Comparing asset classes: where they sit on the liquidity ladder
Think of major asset types as standing on different steps of a liquidity ladder. At the top: cash, savings accounts, treasury bills, and large‑cap ETFs you can exit almost instantly. Mid‑steps: investment‑grade bonds, popular sector and factor ETFs, and many large‑cap stocks—typically fine, but sometimes bumpy under stress. Lower steps: small‑cap shares, high‑yield bonds, niche ETFs that trade by appointment. Near the bottom: private equity funds, hedge funds with lock‑ups, direct lending, physical real estate. The lower you go, the more you must rely on long‑term planning and accept that “mark‑to‑market” values are just estimates until someone actually pays.
How professionals think about portfolio‑wide liquidity
Institutional investors don’t just look at each position; they map liquidity for the whole portfolio. They’ll classify assets by how long it takes to convert them into cash—say 1 day, 1 week, 1 month, 1 year—and then match that to expected liabilities. You can copy this logic at a smaller scale. Break your holdings into “instant,” “soon,” and “later” buckets, and make sure your rent, taxes and near‑term goals are covered by the first two. The rest can live in less liquid, higher‑return territory. This approach doesn’t require fancy models; a simple spreadsheet and honest assumptions about your cash needs already put you ahead of many investors.
Forecast: how liquidity is evolving beyond 2025
Looking ahead from 2025, liquidity is likely to become even more uneven. On one side, major stock and bond markets should stay extremely liquid thanks to tighter spreads, algorithmic market‑making and 24/5 trading on more platforms. On the other, regulation and risk controls are making banks less willing to warehouse risk, so in real stress events we’ll keep seeing “liquidity air pockets” where prices gap with few buyers. Tokenized real‑world assets and blockchain‑based exchanges promise smoother trading for traditionally illiquid assets, but widespread adoption will be slow and patchy. Expect more products that *look* liquid day‑to‑day, yet can slam on redemption gates in a crunch.
Bringing it all together: a practical liquidity game plan
To wrap up, liquidity isn’t just a technical metric—it’s your plan B when life ignores your spreadsheet. Treat each new idea by asking: Where does it sit on my liquidity spectrum? What’s my realistic exit path? Am I overloading on “exciting but sticky” assets? If you keep your emergency fund in truly liquid vehicles, spread risk across different asset types, and stay skeptical of yields that require long lock‑ups, you’ll be well ahead of the crowd. The core lesson for the next decade: returns come and go, but the ability to raise cash when it really matters is what keeps you solvent—and in the game—long enough to enjoy those returns.