
Why crypto market cycles matter
What market cycles are (in human language)
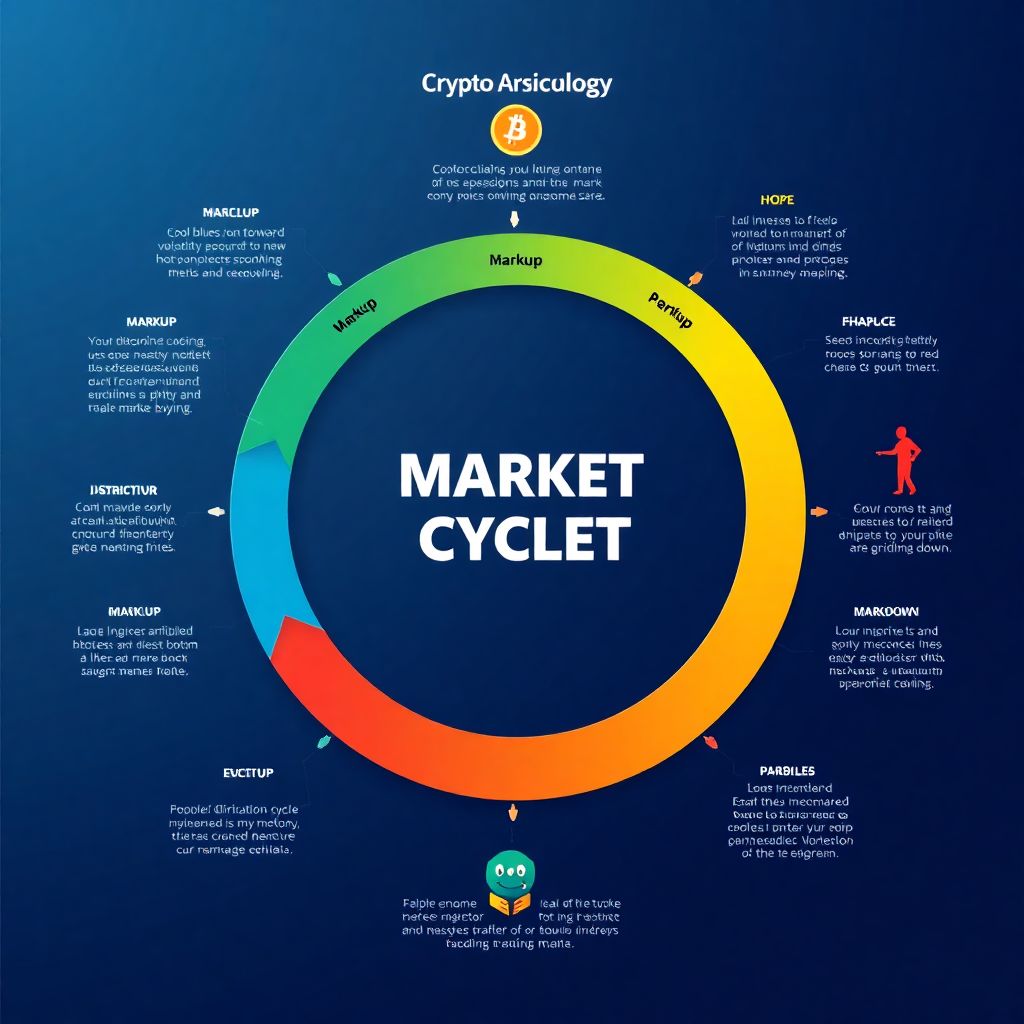
If you strip away the jargon, a market cycle is just the path price usually takes from disbelief and boredom, through hype and euphoria, and back down into fear and apathy. When you see “crypto market cycles explained” in some dense report, it often sounds mystical. In reality, it’s just repeated human behavior plus liquidity conditions. Prices climb as more people are willing to buy higher; they fall when new buyers dry up or big holders start taking profit and there’s not enough demand to absorb the sell pressure. Understanding *where* you are in this loop doesn’t let you predict exact tops or bottoms, but it does change the kind of risks you should or shouldn’t take and how aggressively you deploy capital.
Why cycles beat price predictions
Most people obsess over targets like “Bitcoin to $150k” or “ETH to $10k”. That mindset is fragile: one wrong macro event and the target is useless. Thinking in cycles is more robust. Instead of asking “what price”, you ask “what phase”. Are we in early accumulation, where smart money quietly buys? Are we in markup, where retail crowds arrive? Are we in distribution, where insiders unload on euphoric buyers? Or in markdown, where prices grind down and sentiment is toxic? Approaching the market this way doesn’t require a crystal ball, only a habit of reading structure, sentiment and liquidity. The payoff is practical: position sizing, profit‑taking and patience all become easier because your decisions are tied to context, not to random price guesses.
—
Necessary tools for reading the market
Core data and charting tools
To treat cycles seriously, you need more than a quick glance at a mobile app. Start with solid charting. TradingView or equivalent platforms let you read weekly and daily charts, draw ranges, and overlay indicators like moving averages and volume profiles. This is the backbone for any bitcoin market cycle analysis 2025 or beyond, because long‑term price history gives you a map of previous booms and busts. Add a reliable data source such as CoinGecko or CoinMarketCap for market caps, dominance and sector flows. You don’t need fifty indicators; you need a small set you can actually interpret: volume, long‑term moving averages (like 100/200‑day), basic trendlines and maybe a momentum indicator such as RSI to see when moves look stretched.
On‑chain, sentiment and macro context
For crypto specifically, on‑chain metrics help you see what big holders are doing. Sites like Glassnode, CryptoQuant or similar alternatives highlight inflows to exchanges, realized profits, long‑term holder behavior and stablecoin supply. Combined with funding rates and open interest from derivatives platforms, you get a sense of whether leverage is overheating. Add sentiment dashboards (fear and greed indices, funding rate summaries, social media trend scanners) to catch extremes in optimism or pessimism. Finally, follow macro indicators: interest rates, dollar strength, liquidity conditions and regulatory headlines. Cycles in crypto do not exist in a vacuum; global risk appetite strongly influences whether capital is flowing into or out of speculative assets, directly shaping the amplitude of each phase.
Your personal toolkit: rules, journal, risk template
Even the smartest tools are pointless if you use them inconsistently. Build a simple personal toolkit around them. First, maintain a trading or investing journal: record why you entered, which phase of the cycle you *think* you’re in, and what will make you exit. Over time you’ll see patterns in your own behavior, like always buying late in the hype or panic‑selling during markdown. Second, define a risk template: maximum percentage of portfolio per position, maximum loss per trade, and how you scale in or out across market conditions. This is where the best crypto strategy for bull and bear markets becomes personal; a conservative investor might just rebalance and take partial profits, while an active trader plays shorter swings, but both should have written rules tied to cycle phases, not impulses.
—
Step‑by‑step process: from chaos to a readable cycle
Step 1: Start with the big picture
1. Open a weekly chart of Bitcoin covering several years.
2. Mark previous major tops and bottoms.
3. Sketch rough phases: accumulation, markup, distribution, markdown.
4. Note what macro and sentiment conditions coincided with them.
Think of this as your own mini “crypto trading course market cycles”, but built from real charts instead of theory slides. When you zoom out and look at previous moves in multi‑year context, you stop treating every 10–20% dip as the end of the world. Especially for something like bitcoin market cycle analysis 2025, your first job is to identify whether the new move is echoing earlier expansions or is still in an early basing stage. From there, you can calibrate risk instead of guessing.
Step 2: Pin down which phase you’re in right now
Once the long‑term map is clear, drop to the daily chart and combine it with sentiment and on‑chain data. Ask a sequence of practical questions: Are we near or beyond prior all‑time highs, or still recovering from a deep bear market? Is retail interest spiking—YouTube channels booming, friends asking what to buy, mainstream media celebrating easy gains—or is everyone calling crypto dead? Are long‑term holders selling into strength, and are funding rates on perpetual futures persistently high, signaling crowded leverage? The more of these “late‑cycle” signals you see together, the more cautious you should become. Conversely, when prices have bled for months, headlines are negative, volumes are thin and good projects look abandoned, you’re likely in late markdown or early accumulation, which calls for a very different approach.
Step 3: Turn cycle context into concrete strategy
Now comes the practical pivot: translating phase into action. In early accumulation, your goal is slow, deliberate positioning into assets you actually understand, with a long time horizon and modest size. In markup, you emphasize trend‑following: ride winners, trail stops, add on pullbacks but avoid chasing every candle. In distribution, the focus shifts to de‑risking: scaling out of oversized winners, rotating some capital to stablecoins or less volatile assets, and refusing to FOMO into parabolic spikes. In markdown, preservation dominates—smaller positions, more cash, and selective high‑conviction entries. When people talk about finding the best crypto strategy for bull and bear markets, this is the bridge they often miss: the strategy is not static; it is conditional on the phase. A bull market markup phase tolerates momentum‑based tactics, while a deep bear market punishes the same behavior harshly.
Step 4: Refining how to predict crypto market cycles
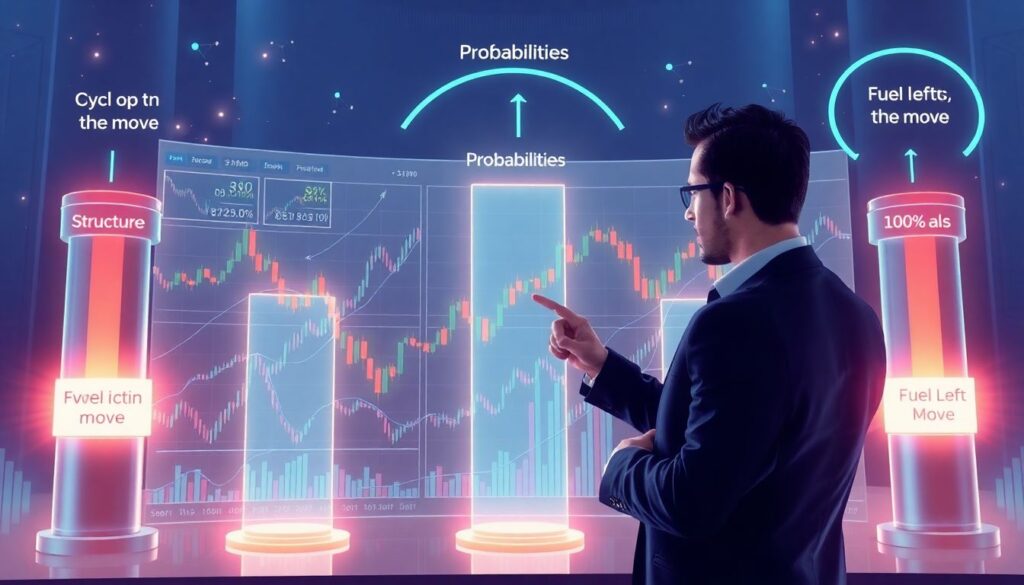
You cannot predict cycles with surgical precision, but you can weigh probabilities. That’s what “how to predict crypto market cycles” really means in a grounded sense: estimating where we stand and how much fuel is left in a move. Practically, you combine three pillars. First, structure: long‑term charts, moving averages, and prior high‑volume regions show where big players previously transacted and are likely to act again. Second, behavior: funding, open interest, on‑chain profit‑taking, wallet distribution and exchange flows reveal whether strong hands are distributing or accumulating. Third, sentiment: surveys, social chatter, meme coin frenzies and Google search interest capture crowd mood. You watch for clusters of extreme signals—overheated leverage plus euphoric sentiment near prior resistance, or despair plus forced selling near historical value zones—to adjust aggression, not to time the exact candle where reversal starts.
—
Troubleshooting common mistakes
Misreading tops, bottoms and “this time is different”
One frequent issue is treating any strong rally as the start of a new bull market or any dump as the final capitulation. This usually happens when you look only at short‑term charts or social media narratives. To fix this, enforce a rule in your process: before believing a “new paradigm” story, check higher‑timeframe structure and macro conditions. Ask whether liquidity is genuinely expanding, whether broader risk markets are healthy, and whether the move has broken important long‑term levels with convincing volume. If your analysis shows that macro is tightening and the move is mostly fueled by leverage and hype, label it as a late‑cycle extension, not a fresh start. You won’t catch exact tops, but you will substantially reduce the number of times you buy right before the distribution phase ends.
Emotional traps and execution errors
Another recurring problem is knowing the theory yet failing in execution. People who could give a lecture on crypto market cycles explained still panic‑sell lows and chase highs. The issue is emotional leverage: position sizes are too large relative to comfort, so every 5–10% move feels existential. The practical fix is boring but effective. First, scale positions down until you can hold them through normal volatility without obsessively checking your phone. Second, pre‑define exit rules—percentage drawdown, break of a key moving average, or cycle‑phase invalidation—before entering. Third, review trades weekly, not daily, focusing on whether you followed your plan given the cycle context. Over time, this reduces the gap between what you know and what you actually do, which is where the real edge lies.
When your framework stops working

Cycles evolve. Correlations shift, new players enter, regulations change. A framework that worked in 2017 or even 2021 might feel off in a new environment. Instead of throwing everything away, treat it like software: periodically refactor. Compare current data to earlier cycles: are drawdowns shallower or deeper, are altcoins lagging or leading, is liquidity more fragmented across chains? Revisit your assumptions about how quickly phases transition and which signals truly preceded major turning points. This is where a structured, almost research‑style mindset pays off more than any rigid “system” from a generic manual. If a signal repeatedly fails, downgrade or remove it. If a new metric (for example, a specific on‑chain behavior) consistently lined up with reversals, promote it in your process. Treat studying the market a bit like an ongoing crypto trading course market cycles are the syllabus, and your portfolio results are the exam.
—
Bringing it all together in daily practice
Simple daily and weekly routine
To make all of this usable, compress it into a repeatable routine. Once a week, run through your big‑picture checklist: review weekly Bitcoin and Ethereum charts, update your phase assessment, and scan key on‑chain and sentiment metrics. Write down a one‑sentence summary: “I believe we are in late‑markup, leverage rising, sentiment hot; I will tighten risk,” or “Early accumulation, volatility low, headlines negative; I’m slowly adding.” On a daily basis, spend a few minutes checking whether anything has invalidated that thesis rather than chasing noise. Over months, this habit compounds: you make fewer impulsive trades, you size positions in line with the environment, and you gradually build an internal library of how different phases *feel* and *behave*. That, more than any single indicator, is what turns raw information about crypto market cycles into a practical, repeatable edge.